Filtered by tag: Methods Remove Filter

Estimating Treatment Effects with the Explanatory Item Response Model

How Much do Scoring Methods Matter for Causal Inference?

The manner in which student outcomes are measured, scored, and analyzed often receives too little attention in randomized experiments. In this study, we aimed to explore the consequences of different scoring approaches for causal inference on test score data. We compared the performance of four methods, Classical Test Theory (CTT) sum scores, CTT mean scores, item response theory (IRT) scores, and the Explanatory Item Response Model (EIRM). In contrast to the CTT- and IRT-based approaches that score the test and estimate treatment effects in two separate steps, the EIRM is a latent variable model that allows for simultaneous estimation of student ability and the treatment effect. The EIRM has a long history in psychometric research, but applications to empirical causal inference settings are rare. Our results show that which model performs best depends on the context.


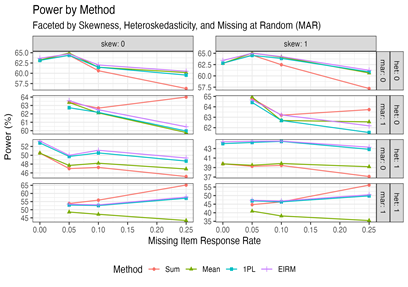
How to Read this Chart: Statistical power (y-axis) by missing item response rate (x-axis) and estimation method (color and shape) shows that the relative performance of each approach depends on the context. The EIRM and IRT-based scores are more robust to missing data and provide the most benefits to power when the latent trait is heteroskedastic. Legend: skew = latent trait is skewed, het = latent trait is heteroskedastic, mar = item responses are missing at random, sum = sum score, mean = mean score, 1PL = IRT theta score, EIRM = explanatory item response model.

Comparative Model Performance

Read More

Statistical Power Analysis for Univariate Meta-Analysis: A Three-Level Model

Statistical power analysis has long been a requirement for researchers seeking funding from the Institute of Education Sciences (IES). As in all individual studies, power analysis is also important when conducting meta-analytic review studies to ensure that the study has sufficient ability to detect an overall treatment effect of interest across a large group of related studies. For example, suppose a meta-analytic review determines that a school intervention significantly improves student performance and has good power to detect that effect, then, researchers will have more confidence in further investing in, developing, and recommending the specific intervention for extensive usage. Calculating statistical power can also inform researchers as they design studies. For instance, power analysis can inform the necessary number of studies needed in their sample to detect an effect across all of those studies in a meta-analysis. This study extends prior research on power analysis for univariate meta-analysis and adds new aspects that facilitate the calculations of statistical power.

A three-level model in meta-analysis considers heterogeneity across research groups

There are a few common approaches to conduct meta-analysis. However, recent realizations suggest that the same authors often publish several studies in a certain topic, and thus may be represented many times in the meta-analysis. To address this issue, approaches to calculating statistical power in these studies should account for the repeated representation of the same study teams. Thus, in our study, we formally introduce methodology that adds third level units in the meta-analysis.

In the proposed three-level meta-analysis, the effect sizes are nested within studies, which in turn are nested within research groups of investigators (see the illustrative figure). Specifically, in this illustration, one effect size (e.g., ES 1) is extracted from each study (e.g., Study 1) and several studies (e.g., Study 1 to Study i) are linked to a research group (e.g., Research Group 1) because they are conducted by the same authors. The variance between these third level units (i.e., research groups) may influence the power of the meta-analysis. Consequently, the proposed three-level model takes into account the between-study (second level) and the between-research group (third level) variances and produces more accurate power estimates.

Read More

Item Response Theory Models for Difference-in-Difference Estimates (and Whether They Are Worth the Trouble)

When randomized control trials are not possible, quasi-experimental methods like Regression Discontinuity and Difference-in-Difference (DiD) often represent the best alternatives for high quality evaluation. Researchers using such methods frequently conduct exhaustive robustness checks to make sure the assumptions of the model are met, and that results aren’t sensitive to specific choices made in the analysis process. However, often there is less thought applied to how the outcomes for many quasi-experimental studies are created. For example, in studies that rely on survey data, scores may be created by adding up the item responses to produce total scores, or achievement tests may rely on scores produced by test vendors. In this study, several item response theory (IRT) models specific to the DiD design are presented to see if they improve on simpler scoring approaches in terms of the bias and statistical significance of impact estimates.

Why might using a simple scoring approach do harm in the quasi-experimental/DiD context?

While most researchers are aware that measurement error can impact the precision of treatment effect estimates, they may be less aware that measurement model misspecification can introduce bias into scores and, thereby, treatment effect estimates. Total/sum scores do not technically involve a measurement model, and therefore may seem almost free of assumptions. But in fact, they resemble a constrained measurement model that oftentimes makes unsupported assumptions, including that all items should be given the same weight when producing a score. For instance, on a depression survey, total scores would assume that items asking about trouble sleeping and self-harm should get the same weight in the score. Giving all items the same weight can bias scores. For example, if patterns of responses differ between treated and control groups, faulty total score assumptions could bias treatment effect estimates and mute variability in the outcome researchers wish to quantify.

What decisions involved in more sophisticated scoring approaches impact treatment estimates?

Read More

Using a Multi-Site RCT to Predict Impacts for a Single Site: Do Better Data and Methods Yield More Accurate Predictions?

Multi-site randomized controlled trials (RCTs) produce rigorous evidence on whether educational interventions “work.” However, principals and superintendents need evidence that applies to their students and schools. This paper examines whether the average impact of an intervention in a particular site—school or district—can be accurately predicted using evidence from a multi-site RCT.

What Methods Did the Study Use to Predict Impacts?

This paper used three methods to predict the average impact in individual sites: (1) the average of the impact estimates in the other sites, (2) lasso regression, and (3) Bayesian Additive Regression Trees (BART). Lasso and BART used a variety of moderators as predictors, including characteristics of participating students, participating schools, the intervention as implemented, and the counterfactual condition.  

How Was the Accuracy of These Predictions Gauged?

Read More

Experimental Design and Statistical Power for Cluster Randomized Cost-Effectiveness Trials

Cluster randomized trials (CRTs) are commonly used to evaluate educational effectiveness. Recently there has been greater emphasis on using these trials to explore cost-effectiveness. However, methods for establishing the power of cluster randomized cost-effectiveness trials (CRCETs) are limited. This study developed power computation formulas and statistical software to help researchers design two- and three-level CRCETs.

Why are cost-effectiveness analysis and statistical power for CRCETs important?

Policymakers and administrators commonly strive to identify interventions that have maximal effectiveness for a given budget or aim to achieve a target improvement in effectiveness at the lowest possible cost (Levin et al., 2017). Evaluations without a credible cost analysis can lead to misleading judgments regarding the relative benefits of alternative strategies for achieving a particular goal. CRCETs link the cost of implementing an intervention to its effect and thus help researchers and policymakers adjudicate the degree to which an intervention is cost-effective. One key consideration when designing CRCETs is statistical power analysis. It allows researchers to determine the conditions needed to guarantee a strong chance (e.g., power > 0.80) of correctly detecting whether an intervention is cost-effective.

How to compute statistical power when designing CRCETs?

Read More

Conjuring power from a theory of change: The PWRD method for trials with anticipated variation in effects

Timothy Lycurgus, Ben B. Hansen, and Mark White

PDF Version

Many efficacy trials are conducted only after careful vetting in national funding competitions. As part of these competitions, applications must justify the intervention’s theory of change: how and why do the desired improvements in outcomes occur? In scenarios with repeated measurements on participants, some of the measurements may be more likely to manifest a treatment effect than others; the theory of change may provide guidance as to which of those observations are most likely to be affected by the treatment.


Figure 1:
Power for the various methods across increasing effect sizes when the theory of change is correct.  

Read More

Selecting Districts and Schools for Impact Studies in Education: A Simulation Study of Different Strategies

Daniel Litwok, Austin Nichols, Azim Shivji, and Robert Olsen

PDF Version

Experimental studies of educational interventions are rarely designed to produce impact evidence, justified by statistical inference, that generalizes to populations of interest to education policymakers.  This simulation study explores whether formal sampling strategies for selecting districts and schools improve the generalizability of impact evidence from experimental studies.

Which selection strategies produced samples with the greatest generalizability to the target population?

Read More

The AIC and aBIC Work Best For Identiying the Correct Number of Profiles in Latent Transition Analysis Applied to Typical Educational Settings

Peter A. Edelsbrunner, Maja Flaig, Michael Schneider

PDF Version

How can we best tell how many different learning patterns there are in our data?

Latent transition analysis is used to describe different learner patterns. However, it is often hard to tell how many patterns there are. Is there a pattern of learners who have little knowledge, another pattern of learners with a specific misconception, and another pattern of learners who have properly understood everything that we tried to teach them? Or are there some of these patterns but not all, or even additional ones? This is really hard to tell, and different indicators (called “relative fit indices”) are available for helping us determinate how many patterns there really are. We compare the performance of several relative fit indices. We find that the Bayesian information criterion (BIC), which is commonly used to determine the number of learning patterns, is not very accurate in finding the right number of patterns in comparison to other indices.

Read More

Does Early Mathematics Intervention Change the Processes Underlying Children’s Learning?

Summary by: Wen Wen

PDF Version

What are “state-” and “trait-” math achievements in early education?

Interventions can boost early math skills, but the role of these early skills on later math achievement is unclear. Consider that students who demonstrate stronger early math skills tend to demonstrate stronger later math achievement, yet some interventions that improve early math skills do not improve later math achievement – that is, the early benefits fade substantially after 2 or 3 years.

Read More

Design and Analytic Features for Reducing Biases in Skill-Building Intervention Impact Forecasts

Daniela Alvarez-Vargas, Sirui Wan, Lynn S. Fuchs, Alice Klein, & Drew H. Bailey

PDF Version

Despite policy relevance, long term evaluations of educational interventions are rare relative to the amount of end of treatment evaluations. A common approach to this problem is to use statistical models to forecast the long-term effects of an intervention based on the estimated shorter term effects. Such forecasts typically rely on the correlation between children’s early skills (e.g., preschool numeracy) and medium-term outcomes (e.g., 1st grade math achievement), calculated from longitudinal data available outside the evaluation. This approach sometimes over- or under-predicts the longer-term effects of early academic interventions, raising concerns about how best to forecast the long-term effects of such interventions. The present paper provides a methodological approach to assessing the types of research design and analysis specifications that may reduce biases in such forecasts.

What did we do?

Read More

Quantifying ‘promising trials bias’ in randomized controlled trials in education

Sam Sims, Jake Anders, Matthew Inglis, Hugues Lortie-Forgues

PDF Version

Randomized controlled trials (RCTs) have proliferated in education, in part because they provide an unbiased estimator for the causal impact of interventions. Yet RCTs are only unbiased in expectation (on average across many RCTs).

Estimates of the effect size from specific RCTs will in general diverge from the true effect due to chance differences between the treatment and control group. In suitably powered trials, this imbalance tends to be small and statistical inference helps to control erroneous findings.

Read More

A Framework for addressing Instrumentation Biases when using Observation Systems as Outcome Measures in Instructional Interventions

Mark White, Bridget Maher, Brian Rowan

PDF Version

Many educational interventions seek to directly shift instructional practice. Observation systems are used to measure changes in instructional practice resulting from such interventions. However, the complexity of observation systems creates the risk of instrumentation biases. Instrumentation bias is bias resulting from changes to the ways that an instrument functions across conditions (e.g., from pre-test to post-test or between control and intervention conditions). For example, teachers could intentionally show off intervention-specific practices whenever they are observed, but not otherwise use those practices. Alternatively, an instructional intervention could shift instruction in ways that increase observation scores without impacting the underlying instructional dynamics that support student learning.

This conceptual paper with a case study exemplar provides a validity framework for using observation systems to evaluate the impact of interventions. Inferences about an intervention’s impact generally involve determining whether a teaching practice has changed within some setting. Observation scores, the evidence for these conclusions, are specific raters’ views of how a rubric would describe observed lessons. The conclusions are far more generalized than the observation scores. The framework (see Figure below) systematically breaks down the processes necessary to operationalize an aspect of teaching practice and sample from a setting to obtain observation scores that can be generalized to draw conclusions.

Read More

A recipe for disappointment: policy, effect size and the winner’s curse

Adrian Simpson

PDF Version

Effect size and policy

Standardized effect size estimates are commonly used by the ‘evidence-based education’ community as a key metric for judging relative importance, effectiveness, or practical significance of interventions across a set of studies: larger effect sizes indicate more effective interventions. However, this argument applies rarely; only when linearly equatable outcomes, identical comparison treatments and equally representative samples are used in every study.

Read More

The Meta-Analytic Rain Cloud (MARC) Plot: A New Approach to Visualizing Clearinghouse Data

Kaitlyn G. Fitzgerald & Elizabeth Tipton

PDF Version

What type of data do clearinghouses communicate?

As the body of scientific evidence about what works in education grows, so does the need to effectively communicate that evidence to policy-makers and practitioners. Clearinghouses, such as the What Works Clearinghouse (WWC), have emerged to facilitate the evidence-based decision-making process and have taken on the non-trivial task of distilling often complex research findings to non-researchers. Among other things, this involves reporting effect sizes, statistical uncertainty, and meta-analytic summaries. This information is often reported visually. However, existing visualizations often do not follow data visualization best practices or take the statistical cognition of the audience into consideration.

Read More

Modeling and Comparing Seasonal Trends in Interim Achievement Data

James Soland & Yeow Meng Thum

PDF Version

Introduction

Interim achievement tests are often used to monitor student and school performance over time. Unlike end-of-year achievement tests used for accountability, interim tests are administered multiple times per year (e.g., Fall, Winter, and Spring) and vary across schools in terms of when in the school year students take them. As a result, scores reflect seasonal patterns in achievement, including summer learning loss. Despite the prevalence of interim tests, few statistical models are designed to answer questions commonly asked with interim test data (e.g., Do students whose achievement grows the most over several years, tend to experience below-average summer loss?). In this study we compare the properties of three growth models that can be used to examine interim test data.

Read More

Examining the Earnings Trajectories of Community College Students Using a Piecewise Growth Curve Modeling Approach

Summary by: Lily An

PDF Version

Traditional methods of estimating the returns to community college remain imprecise.

Historically, to estimate the labor market returns to a community college degree, researchers have compared the earnings of students who completed a degree to those who did not, at a single point in time, while controlling for background characteristics. With the expansion of longitudinal data sets, researchers have begun to consider how earnings before and during community college can affect returns to community college. However, even improved econometric analyses overlook some temporal influences on predicted earnings growth, such as the time between graduation and measured earnings, instead estimating averaged returns over time. These influences are particularly salient for community college students, who vary in their time-to-degree completion and often enter college with pre-existing or concurrent work experiences.

Read More

Parasympathetic Function: Relevance and Methodology for Early Education Research

Summary by: Lindsay Gomes

PDF Version

The definition of school readiness in the contexts of educational research, practice, and policy has changed considerably over the past 60 years. After a long period of prioritizing academic skills (e.g., letter-shape knowledge), many researchers now emphasize the extent to which young children can control their emotions and behaviors as key to school readiness. This capacity is commonly referred to as self-regulation, which is often defined in terms of volitional, cognitively-mediated processes such as executive functions. In this paper, we assert that understanding children’s parasympathetic function is essential to providing a holistic understanding of self-regulation in the classroom and for informing how the classroom environment can be tailored to most effectively promote young children’s development.

What is parasympathetic function and why is it important?

Read More

Gather-Narrow-Extract: A Framework for Studying Local Policy Variation Using Web-Scraping and Natural Language Processing

Kylie L. Anglin

PDF Version

Many education policy decisions are made at the local level. School districts make policies regarding hiring, resource allocation, and day-to-day operations. However, collecting data on local policy decisions has traditionally been expensive and time-consuming, sometimes leading researchers to leave important research questions unanswered.

This paper presents a framework for efficiently identifying and processing local policy documents posted online – documents like staff manuals, union contracts, and school improvement plans – using web-scraping and natural language processing.

Read More

Mitigating Illusory Results through Preregistration in Education

Summary by: Claire Chuter

PDF Version

Good researchers thoroughly analyze their data, right? Practices like testing the right covariates, running your analyses in multiple ways to find the best fitting model, screening for outliers, and testing for mediation or moderation effects are indeed important practices… but with a massive caveat. The aggregation of many of these rigorous research practices (as well as some more dubious ones) can lead to what the authors call “illusory results” – results that seem real but are unlikely to be reproduced. In other words, implementation of these common practices (see Figure 1 in the article), often leads researchers to run multiple analytic tests which may unwittingly inflate their chances of stumbling upon a significant finding by chance.

Potential Solutions

Read More

Partially Identified Treatment Effects for Generalizability

Wendy Chan

PDF Version

Will this intervention work for me?

This is one of the questions that make up the core of generalization research. Generalizations focus on the extent to which the findings of a study apply to people in a different context, in a different time period, or in a different study altogether. In education, one common type of generalization involves examining whether the results of an experiment (e.g., the estimated effect of an intervention) apply to a larger group of people, or a population.

Read More