
Summary by: Sophia Li
Displays of school information affect parents’ decisions and decision-making process
Parents increasingly choose between schools for their children to attend. The way in which school data - safety, resources, distance, and academic performance - is presented affects how parents rank and choose schools.
In this study, researchers looked at how changing the displays of school data affects how parents choose between schools. Specifically, they examined how the data format (e.g., numbers, letter grades, data visualizations), showing district averages, showing parent ratings, the number of metrics, and the default sort order of the schools affects the characteristics of the school each parent ranked first. For example, showing district averages as a reference point when evaluating a school results in safer first-ranked schools; showing the schools sorted by academic quality by default results in higher academic quality in first-ranked schools.
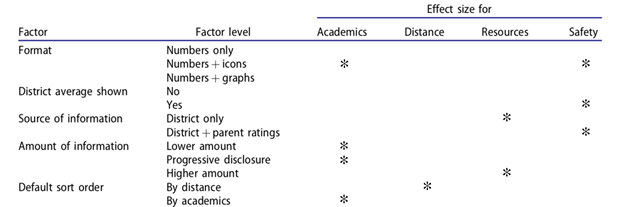
Note: Stars denote display strategies that have at least a 70% chance of having a positive effect (from a Bayesian posterior) on each column.
The researchers also explored how these factors influence parents’ subjective experience of the decision-making process, measured by 1) knowledge of the information presented, 2) ease of use, and 3) overall satisfaction. Examples of specific results include that showing numbers only (without graphs or icon) improves understanding, that not showing district average improves ease of use, and that showing the highest amount of information improves satisfaction.
How did the authors conduct this study?
The authors conducted this experimental study online with 3,500 parents who reported a household income of less than $40,000 and had at least one child between the ages of 3-18. Researchers created hypothetical school profiles; each contained data on distance, academic performance, safety, and school resources (e.g. technological). Parents saw 16 hypothetical school profiles presented in a randomly selected display. School displays varied on 1) format (how data was presented), 2) whether a district average was presented as a benchmark, 3) source of information (whether parents’ opinions were also presented), 4) amount of information (number of measures presented), and 5) default sort order (by distance or academic quality) of the schools.
Full Article Citation:
Glazerman, S. Nichols-Barrer, I, Valant, J., Chandler, J., Burnett, A. (2020). The Choice Architecture of School Choice Websites. Journal of Research on Educational Effectiveness, 13(2), 322-350. DOI: https://doi.org/10.1080/19345747.2020.1716905