
Modeling and Comparing Seasonal Trends in Interim Achievement Data
James Soland & Yeow Meng Thum
Introduction
Interim achievement tests are often used to monitor student and school performance over time. Unlike end-of-year achievement tests used for accountability, interim tests are administered multiple times per year (e.g., Fall, Winter, and Spring) and vary across schools in terms of when in the school year students take them. As a result, scores reflect seasonal patterns in achievement, including summer learning loss. Despite the prevalence of interim tests, few statistical models are designed to answer questions commonly asked with interim test data (e.g., Do students whose achievement grows the most over several years, tend to experience below-average summer loss?). In this study we compare the properties of three growth models that can be used to examine interim test data.
Current Models Used with Interim Achievement Data
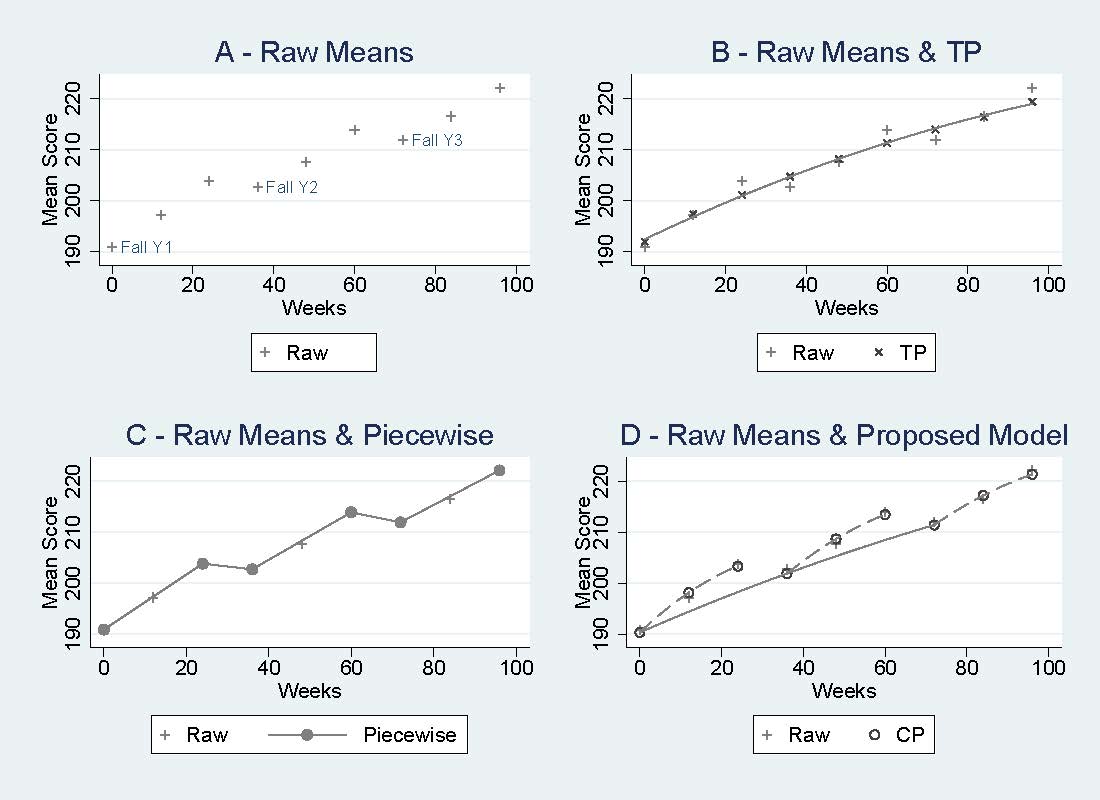
Figure 1: Mean scores over time with different growth models.
Figure 1 Panel A shows raw means from our data over three years, with instructional weeks on the horizontal axis (the time between Spring and Fall are the weeks between instructional days). Scores are available from Fall, Winter, and Spring in each year. As the plot shows, achievement tends to increase during the school year, then decline between Spring and Fall (summer loss). One option for modeling such data, shown in Panel B, is to fit a traditional polynomial (TP) growth curve model to all the data points. However, this approach ignores seasonal trends. That is, the model (represented by the smooth line) understates mean scores in the Spring and overstates them in the Fall. Thus, seasonal patterns are ignored, and trends mischaracterized. By contrast, Panel C shows a piecewise model, which essentially fits separate regressions for each within-year growth segment, as well as each Spring to Fall period. While a piecewise model captures seasonality, it does not quantify growth across all three years, which the TP does.
The Compound Polynomial (CP) Model
By contrast, Panel D conceptualizes a model that captures both across-year growth (like the TP) and within-year gains/losses, including summer loss (like the piecewise). Thus, researchers can directly model curvilinear growth across years, and see how that growth relates to phenomena like summer loss. Our study presents details on how to fit such a model, which we call the CP.
Determining which Model to Use
When deciding between the piecewise and CP model, the choice is mainly theoretical. If one wants to quantify summer loss separately in each year, then the piecewise model is preferable. If one wants to compare across-year growth and seasonal, within-year patterns, then the CP is preferable. Meanwhile, our results show that simply fitting the TP to the data introduces substantial bias that can affect metrics like effect sizes for growth. Thus, when one wants to model across-year growth without simply discarding all but a single timepoint for a given year, the CP is the defensible choice.
Full Article Citation:
Soland, J., Thum, Y.M. (2022). Estimating and Comparing Growth Using Longitudinal Interim Achievement Data with Seasonal Trends. Journal of Research on Educational Effectiveness. DOI: https://doi.org/10.1080/19345747.2021.2018744.