
The AIC and aBIC Work Best For Identiying the Correct Number of Profiles in Latent Transition Analysis Applied to Typical Educational Settings
Peter A. Edelsbrunner, Maja Flaig, Michael Schneider
How can we best tell how many different learning patterns there are in our data?
Latent transition analysis is used to describe different learner patterns. However, it is often hard to tell how many patterns there are. Is there a pattern of learners who have little knowledge, another pattern of learners with a specific misconception, and another pattern of learners who have properly understood everything that we tried to teach them? Or are there some of these patterns but not all, or even additional ones? This is really hard to tell, and different indicators (called “relative fit indices”) are available for helping us determinate how many patterns there really are. We compare the performance of several relative fit indices. We find that the Bayesian information criterion (BIC), which is commonly used to determine the number of learning patterns, is not very accurate in finding the right number of patterns in comparison to other indices.
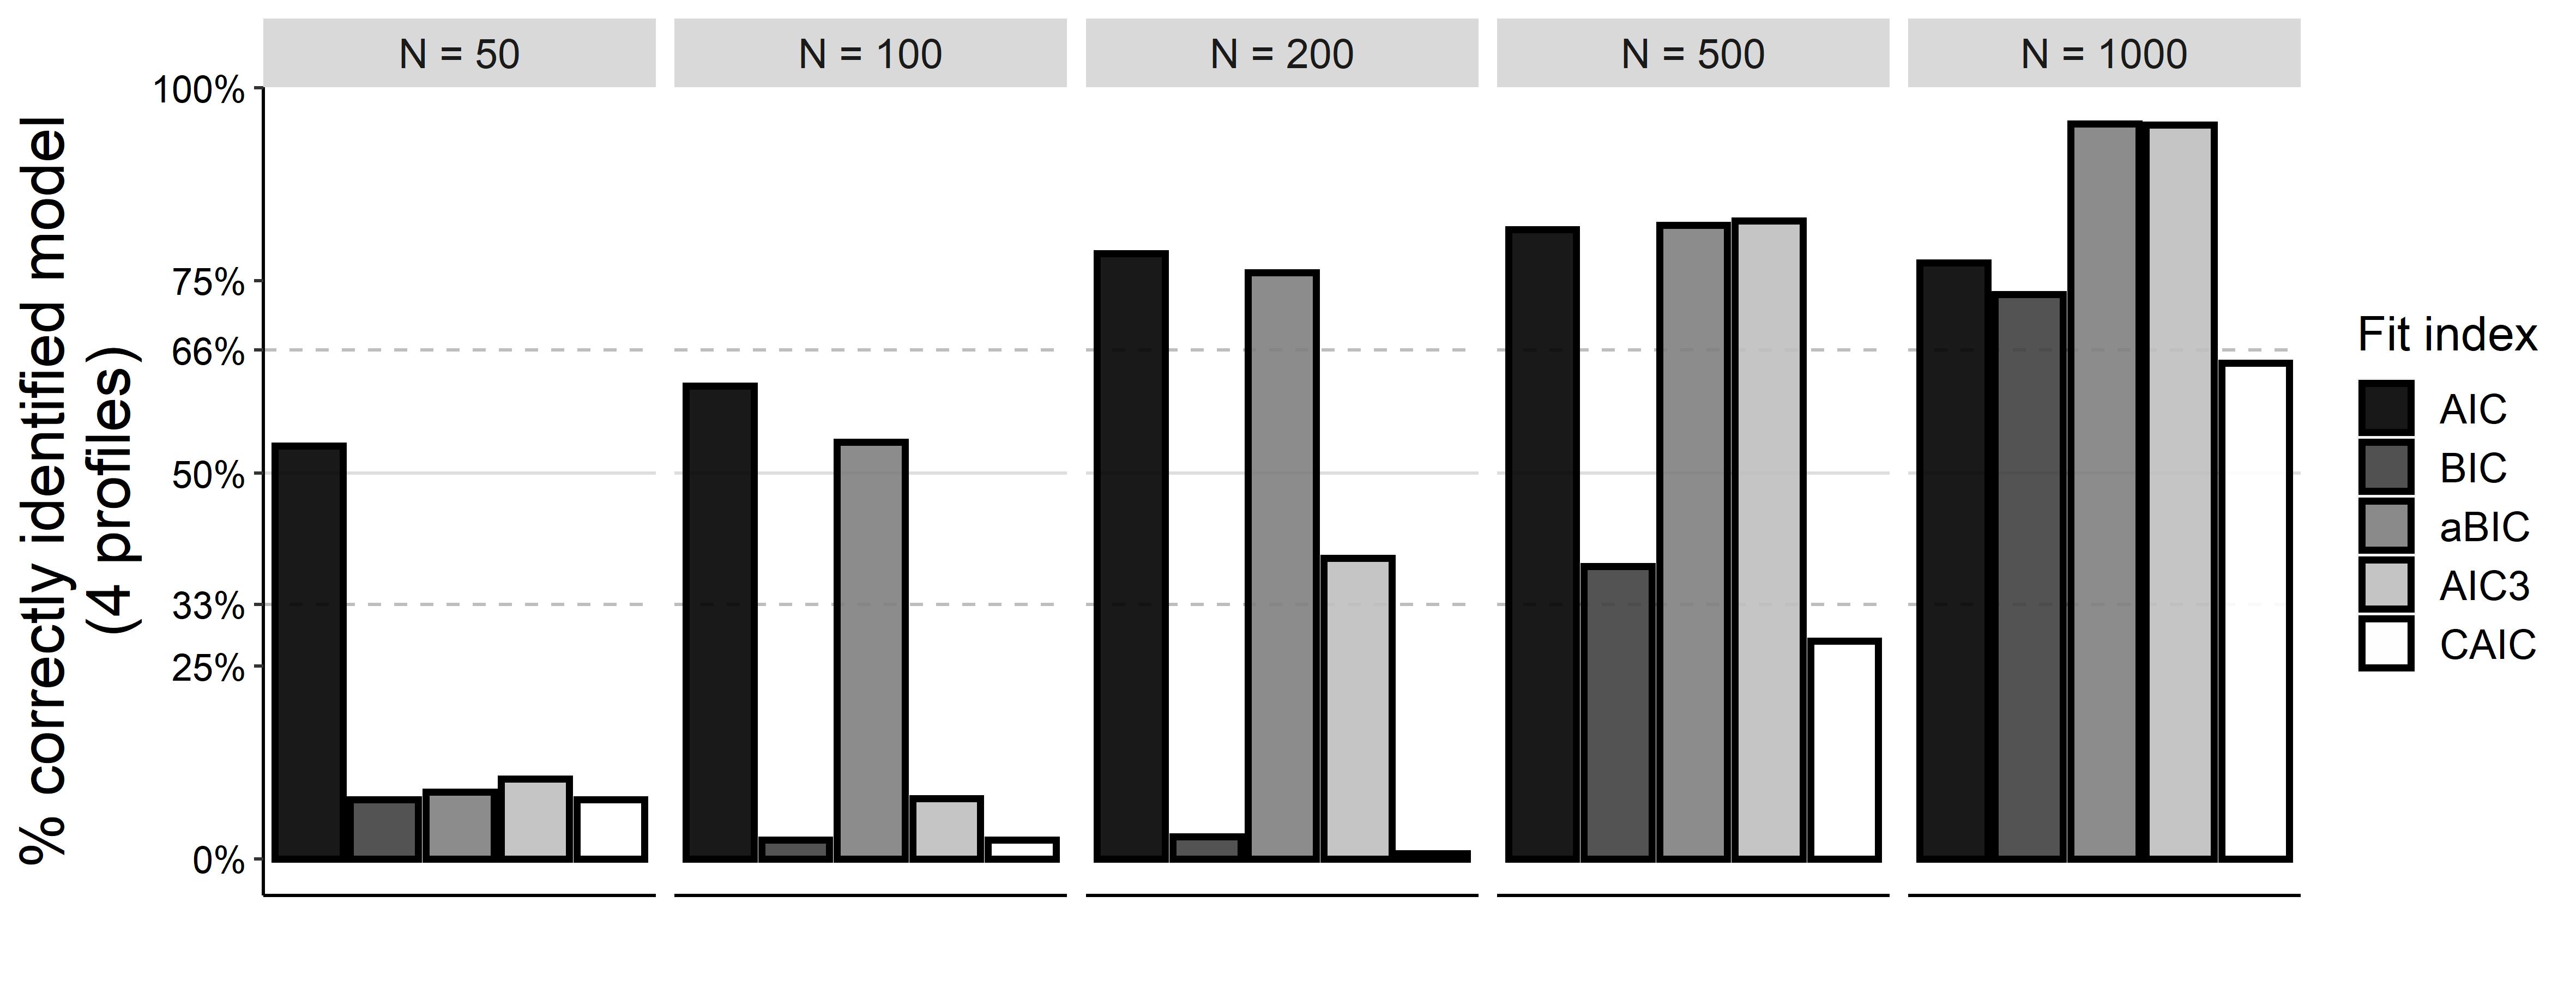
How to read this chart: The chart shows that the AIC and aBIC relative fit indices have the best overall accuracy in pointing researchers towards the correct number of learner profiles. Only in larger samples, the AIC engages in overfitting, with the aBIC and AIC3 performing best.
What are learner profiles, and what do we analyze them for?
In some subjects and topics, learners go through specific patterns of the knowledge they possess, or the motivation they show, regarding specific contents. For example, when learning about buoyancy force in Physics, learners show typical misconceptions, such as that objects that are heavy always sink, whereas all objects that are light float. We can study these patterns and describe them as “learner profiles.” When we collect data from the same learners multiple times, we can use latent transition analysis to examine how they develop through common patterns over time, and how this depends, for example, on the instruction that they receive. We wanted to find out which statistical metrics can tell us, most reliably, how many distinct (yet common) patterns there are.
How did we do this study?
We simulated data that represent learner profiles which prior studies have found in educational data, and how learners go through these profiles in the course of learning. We then examined which relative fit indices work better or worse for showing us how many learner profiles there are. Since we simulated the data, we knew that there really were four profiles, and could see throughout variations of typical study conditions (e.g., different numbers of analyzed learners), which statistical indices work best in showing that there are four learner patterns and not more or less. In this way, we could see that a metric that is commonly used (the BIC) does not work well, whereas one that was commonly thought to work rather poorly (AIC) worked well across a number of conditions. We will have to see in future simulation studies how these present results hold across further conditions. The AIC is usually assumed to show much more overfitting than we have found here, but this might be explained by the specific data structure that we simulated. We also present a first robustness analysis regarding this question.
Full Article Citation:
Edelsbrunner, P.A., Flaig, M, & Schneider, M. (2022). A Simulation Study on Latent Transition Analysis for Examining Profiles and Trajectories in Education: Recommendations for Fit Statistics. Journal of Research on Educational Effectiveness. DOI: https://doi.org/10.1080/19345747.2022.2118197.